 This page
describes the options that determine how the sequence is displayed in the GANTT chart.
Depending on your licenses, you may have access to one or more of the
following types of Gantt charts.
-
Process-centric Gantt
-
Resource Utilization-centric Gantt
-
Manufacturing System-centric Gantt
-
Process-centric Resource Gantt
Unless otherwise specified, the options selected on this tab apply to
all Gantt charts to which you have access. The options include:
Display Options
|
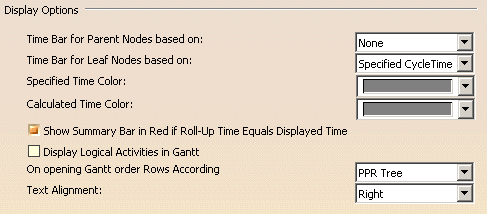 |
Time Bar for Parent Nodes Based On:
|
|
Time Bar for Leaf Nodes Based On:
|
|
Specified Time Color
|
|
|
Calculated Time Color
|
|
|
Show Summary Bar in Red if Roll-up Time Equals Display Time
|
|
When you select this option, if the calculated cycle time is less than the specified time, the
summary bar is red in color (instead of blue).

 The
default is that the check box is selected. The
default is that the check box is selected. |
Display Logical Activities in Gantt
|
|
This option determines whether any defined logical activities are displayed in the
GANTT viewer.
The
default value is that the option is not selected.
|
On Opening Gantt order rows according
|
|
When you select PPR Tree, the Gantt chart opens with its rows
sorted in the same order as the activities appear in the PPR tree.
When you select Begin times, all rows of the same sibling
hierarchy inside the Gantt are sorted according their begin times. Child
rows stay beneath their parents.
In case several row objects have the same begin time, they are
grouped together in the Gantt, and within the group, their ordering
follows that of the the PPR tree. For the different types of Gantt
charts, the effect of selecting Begin times is:
-
Process-centric Gantt: The Gantt
chart opens on an activity. This activity and its children are shown. No Resources
are shown on their own rows.
-
Resource Utilization-centric Gantt:
The Gantt chart opens on a resource. This resource and all
assigned activities of that resource are shown on their own rows
-
Manufacturing System-centric Gantt:
The Gantt chart opens on a resource. This resource and all
activities that are children (and grandchildren) of that resource are shown
on their own rows
-
Process-centric Resource Gantt: - The Gantt
chart opens on an activity. This activity and its children (and
grandchildren) are shown; also all assigned resources are shown on their
own rows
|
Limitations
-
When changing the begin time of a row
object in an opened Gantt, there is no reordering.
-
When creating links between activities, their
corresponding rows do not change their position.
-
When you insert an activity it is placed at the end of the sibling list
of rows.
-
A multi-cycle Gantt always uses the
begin times of the cycle 1 objects.
Example of Sorted Gantt Rows
The
default value is PPR Tree.
|
Text Alignment
|
 |
Resource Gantt Options
|
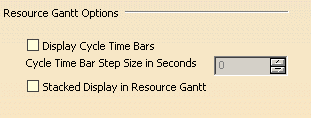 |
Display Cycle Time Bars
|
|
Selecting the Display Cycle Time Bars check box enables you to display
cycle time bars in the Gantt chart.
The
default value is that the option is not enabled. |
Cycle Time Bar Step Size in Seconds
|
|
If you select the Display
cycle time bars check box, you can set the step size time of the
the cycle time bar. The cycle time bar in a Gantt chart can be changed according
to the defined step size. For example, if the step size is set
to 20 sec, the cycle time pf 80 sec can be
changed only in increments of 20 sec. To decrease the time
from 80 sec in Gantt the time goes first to 60 sec, then 40 sec. To increase the time from 80 sec in Gantt, the time goes
first to 100 sec, and so on.
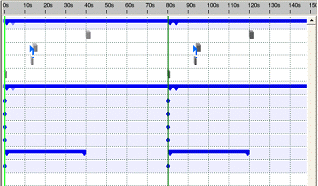
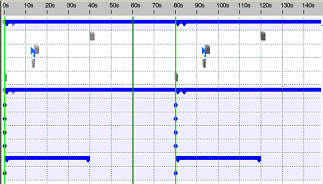
Here, for example, is a Gantt chart with the cycle time set to 80 sec
(the vertical green line in the middle) |
 |
|
With the step size set to 20 sec, this cycle time can be decreased to 60
sec: |
 |
|
Or increased to 100 sec: |
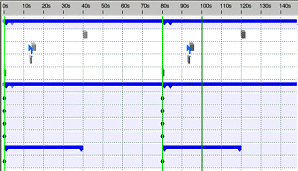 |
Stacked Display in Resource Gantt
|
|
When enabled, this option collapses all sequential activities corresponding to a
single resource to one line in the resource-centric GANTT viewer. Activities are displayed as rectangular bars,
with the width of the bar corresponding to the duration of the activity.
The
default value is that the option is not enabled. |
|
|
|