 |
-
Click Open Gantt Chart
 . .
-
When the Gantt chart appears, right-click on the
time scale at the top of the right frame and select SetScaleUnits.
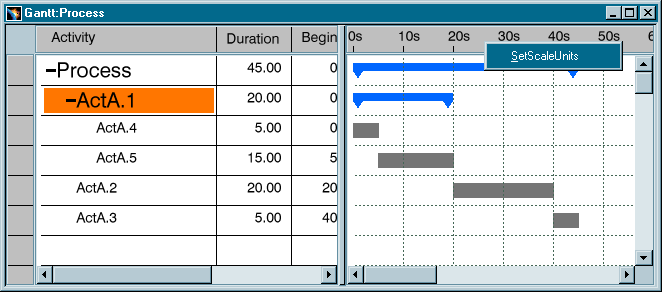
The Time Scale dialog box appears.
-
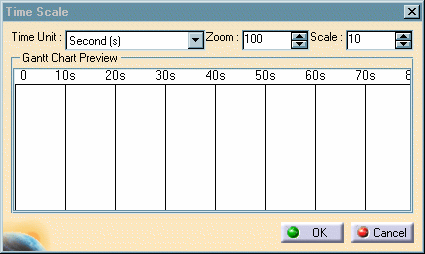
Set the time scale options. The options are:
- Time Unit
This is the standard V5 time option. The units of the grid can be set to seconds (s), millliseconds (ms), hours
(h), or minutes (mn). Time units can also be set from the Units tab of the
Tools > Options > General > Parameters.
- Zoom
The Zoom value allows for the granularity of the grid to be increased or decreased, allowing the same scale to
be viewed in a larger or smaller space.
- Scale
This field defines the grid increments. For example, if the Time Unit option is set to
Minute (mn), a
Scale value of "5" would result in grid lines representing 0mn, 5mn, 10mn, and so on.
- Gantt Chart Preview
This window provides a preview of the Gantt chart which reflects any changes that have been made to its
appearance. If the changes are satisfactory, click OK to
accept the changes and close the dialog. To cancel any changes
that have been made, click Cancel.
|
-
Click OK.
|