|
Connect Checker Types
- Elements:
- Source: available in all five types of CCK.
- Target: enabled for CCK Type, “Curve Extremity and Curve” and “Surface Border and Surface” only.
- Filter Types according to pair of
elements:
-
 Curve-Curve Connection:
Connection analysis when two curves are selected as input
elements.
 -
 Surface-Surface Connection:
Connection analysis when two surfaces are selected as input
elements.
 -
 Surface-Curve Connection:
Connection analysis when one surface and one curve are selected
as input elements.
-
- Filter Types according to the
connection mode between two elements:
-
 Boundary:
connection analysis between the boundaries of two
elements will be performed.
Boundary:
connection analysis between the boundaries of two
elements will be performed.- Surface-Surface: CCK between surfaces' borders, type corresponding to the old Surface Connect Checker.
- Curve-Curve: CCK between curves' extremities, type corresponding to the old Curve Connect Checker.
-
 Projection:
connection analysis between the boundary of one element and
projection of that boundary on another element will be
performed.
Projection:
connection analysis between the boundary of one element and
projection of that boundary on another element will be
performed.- Curve-Curve: CCK between a curve's extremity and its projection on a curve.
- Surface-Surface: CCK between a surface's border and its projection on a surface.
- Surface-Curve: CCK between a curve's extremity and its projection on a surface.
-
Open the FreeStyle_09.CATPart document.
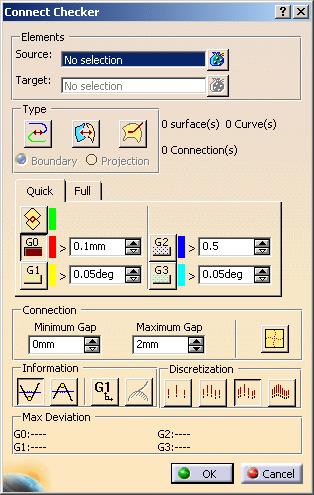
The Connect Checker dialog box is displayed. The Connect Checker dialog box proposes two layers to switch between the quick and the full analysis mode:
- Full Analysis mode
- Quick Analysis mode
Full Analysis mode

- Display:
The full mode
is selected, in this case only one continuity analysis type is
performed, the colors and the range of values are managed in a specific
tool: the color scale. Select any of the two color scale mode:
-
Limited Color Scale: In this mode, a specific color and a specific threshold are associated to the continuity type.

-
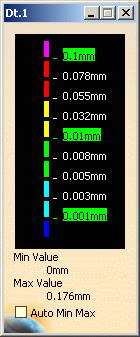
Full Color Scale: In this mode, only one type on continuity is performed, therefore a color scale allows you to work with range of values.


The color scale dialog box is available only when the Connect Checker Analysis  command is active.
- If you end the Connect Checker Analysis command, even if the color scale mode is On, the color scale dialog box is not displayed.
- If you edit the connect checker and if the color scale mode is On, the color scale dialog box is displayed.
-
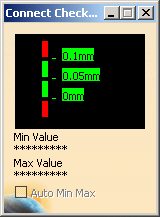
The Auto Min Max button enables to automatically update the minimum and maximum values (and consequently all values between) each time they are modified.
-
You can right-click on a color in the color scale to display the contextual menu:

-
Edit: it allows you to modify the values in the color range to highlight specific areas of the selected surface. The Color dialog box is displayed allowing you to modify the color range.

-
Unfreeze: it allows you to perform a linear interpolation between non defined colors. The unfreezed values are no longer highlighted in green.
-
No Color: it can be used to simplify the analysis, because it limits the number of displayed colors in the color scale. In this case, the selected color is hidden, and the section of the analysis on which that color was applied takes on the neighboring color.
-
You can also right-click on the value to display the contextual menu:

-
Edit: it allows you to modify the edition values. The Value Edition dialog box is displayed: enter a new value (negative values are allowed) to redefine the color scale, or use the slider to position the distance value within the allowed range, and click OK. The value is then frozen, and displayed in a green rectangle.

-
Use Max/Use Min : it allows you to evenly distribute the color/value interpolation between the current limit values, on the top/bottom values respectively, rather than keeping it within default values that may not correspond to the scale of the geometry being analyzed. Therefore, these limit values are set at a given time, and when the geometry is modified after setting them, these limit values are not dynamically updated.
The Use Max contextual item is only possible if the maximum value is higher or equal to the medium value. If not, you first need to unfreeze the medium value. Only the linear interpolation is allowed, meaning that between two set (or frozen) colors/values, the distribution is done progressively and evenly.
-
- Combo: Allows you to switch
between the four predefined discretization coefficients the icon
layout changed to show current discretization level. You can choose the discretization, that is
the numbers of spikes in the comb (check the Comb option to see
the difference).
The number of spikes corresponds to the number of points used for the
computation:
- Fine: 45 spikes are displayed
- Medium: 30 spikes are displayed
- Coarse: 15 spikes are displayed
- Light: 5 spikes are displayed.
This mode enables to obtain consistent results with the visualization of sharp edges.
An edge is considered as sharp if its tangency deviation is higher than 0.5 degree. To only detect tangency deviations on sharp edges, specify a deviation of 0.5 degree minimum.
To visualize sharp edges, make sure the View > Render Style > Shading with Edges and Hidden Edges option is checked.
- From the Connect Checker dialog box, you can
choose a number of visualization and computation options:
- the comb: that is the spikes corresponding to the distance in each point.
- the envelope: that is the curve connecting all spikes together.
- the Information: that is the minimum and maximum values displayed in the 3D geometry.
- The minimum and the maximum computed values are displayed in
color scale. Right-click on the color scale and check the following
three options in the contextual menu:
- Edit: Used to define a color associated to a range of values.
- Unfreeze: Used to allow a linear interpolation of colors between two frozen colors.
- No color: Used to hide the analysis result for a range of values.
- Amplitude: The Amplitude
Factor allows you to scale the reference by a certain factor
automatically or manually. Below given is the Amplitude dashboard.

-
 Auto Scaling:
Click on this button to scale the reference automatically.
 -
 Multiply by 2:
Multiply the scaling factor by 2.
 -
 Divide by 2:
Divide the scaling factor by 2.
-
The 100 (percent) option depicts the standard level of the scaling factor on which multiplication or division of scaling factor can be performed.
- Connection
- Maximum Gap: To get connection between two input elements, the gap between those two elements must be less than or equal to Maximum Gap.
- Minimum Gap: To display deviation results in graphics area between two input elements, the gap between those two elements must be greater than or equal to Minimum Gap

Connection analysis of one element with two different elements will have different deviation results as the topology of these elements is different. The connection analysis follows a different algorithm to measure the gap. - Consider connection analysis of one
element A with two different elements B and
C.
- If the connection of A and B at Maximum Gap is 10mm, it is not necessary that the connection between A and C will also be detected with the same Maximum Gap.
- If connection between element A and C has a Maximum Gap of 20 mm, it is not necessary that deviation results (specifically G0 results) will be greater than the results of connection between A and B elements.
Consider a case where two elements say A and B at connection have the Maximum Gap as 10mm with G0 value 6.5mm. Now if the Maximum Gap value is increased to 15 mm, the second found connection between A and B can have G0 value as 7.6 mm.
- Information: In the case you select several types of
continuity, the Information button is grayed out.
- You can check the Overlapping button to highlight where, on the common boundary, the two surfaces overlap. In this case the other analysis types are deactivated.
- You can check the Information
button to display the minimum and maximum values in the 3D geometry, or
uncheck it to hide the values.
- MinInfo: For surfaces, with the ON/OFF of MinInfo button, the information for Min values will be displayed.
- MaxInfo: For surfaces, with the ON/OFF of MaxInfo button, the information for Max values will be displayed. With change in descritization, observe the change in Max value display in dialog box and in graphics area. For curves, observe Max value in graphics and dialog box is similar for each continuity type.
- G1 vales within range of 0 to 90 degree: The current G1 values come from 0 to 180 deg. It may be confusing that the 180 deg value whereas 2 surfaces are tangent, but superposed for instance. It is the reason why it should be better to have an option so that the you can choose the interval of G1 values: 0 - 180 deg or 0 - 90 deg (if G1 > 90 deg, then G1 = 180 - G1). When you select range 0 – 90 degree, representation of analysis will be recomputed. The representation of analysis, with “G1 value” button is ON and OFF will be different, if result values have value more than 90 degree.
- Discretization:The combo allows you to switch between the four predefined discretization coefficients the icon layout changed to show current discretization level.
- Maximum Deviation:Deviations are computed for G0, G1, G2, G3 continuity. You can get the information about Overlap defect and concavity defect.
Quick Analysis mode

In this case several continuity types can be performed at the same time, a color and a threshold is associated to each continuity type. In the quick analysis mode a specific color, a threshold and a max value (a numerical feedback of the analysis) are associated to each type.
Some continuity types are combinable, the priority order is G0, G1, G2, G3 and Overlap. However, the overlap type is not combinable. Each color is editable.

Implicit Mode
- CCK between surfaces' borders,
- CCK between curves' extremities,
- CCK between a curve's extremity and its projection on a surface
An implicit mode depends on selected element types:
- The first selected element is a surface:
- The second selected element is a surface, the connect checker analysis is the surface connect checker
- The second selected element is a curve, the connect checker analysis is the surface-curve connect checker
- The first selected element is a 3D curve:
- The second selected element is a 3D curve, the connect checker analysis is the curve connect checker
- The second selected element is a surface, the connect checker analysis is the surface-curve connect checker
- The selected elements are surfaces edges, a curve connect checker analysis is performed
- In case of multi selection, if curves and surfaces are selected, the surface connect checker is applied on the set of selected surfaces and the curve connect checker is applied on the set of selected curves.
Explicit Mode
- The explicit mode defined through the dialog box:
- The surface connect checker is set on, only the surfaces in the selected elements set are taken account to perform the analysis.
- The curve connect checker is the current mode, only curves or surfaces edges in the selected elements are taken in to account.
- The surface curve connect checker is the current mode, the set of the selected surfaces and the set of the 3D curves are taken account to perform the analysis.
Memory Use
- The warning message informs you about how many connections have been
found and created when memory use limit is reached. The warning message
box also gives information about the number of input elements analyzed
from the selection.
For example if you have set memory limit as 70% and and 127 connection has been found out of 150 selected elements, the following warning message might be displayed depending on connections found and analyzed:
Connections found (127) have reached 70 percent of Memory. Analyzed objects are 87. Connections created are 126.
Recommendation: Try to save your data and re-start the session. - After the warning message is displayed in the Connect Checker command, further connection analysis is stopped.
- If some of the inputs have been already analyzed (till the point the memory use exceeds the given limit), the result of connect analysis is shown for these input elements. The input elements analyzed, till the memory use limit, are displayed in Connect Checker dialog box as selection in the Elements field.
- The other selected elements for which the connections have not been found are removed from the connect checker selection.
Matching Constraint for Analysis
 |
|
|