Open the IsoCurvature.CATPart document.
-
Click the Iso-Curvature Analysis icon
 .
.
The Iso-Curvature Analysis dialog box is displayed.
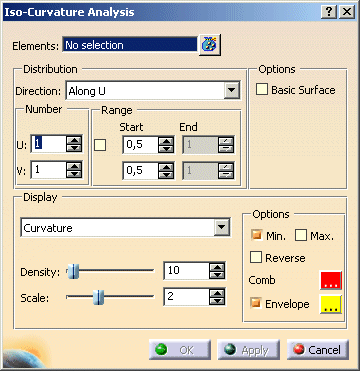
You can define the following options:
- Elements: Elements used for the calculation of the iso-curvature analysis.
- Distribution: Distribution of the iso curves.
- Direction:
- Along U: All iso curves are displayed parallel to the U direction of each selected surface element.
- Along V: All iso curves are displayed parallel to the V direction of each selected surface element.
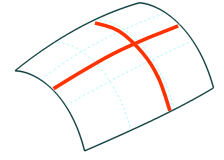
- Along U & V: All iso curves are displayed parallel to both the U and V directions of each selected surface
element.

- Number U or V: Number of iso-curvature lines to be displayed in the direction for both U and V directions.

Hint: If only one iso curve per direction is displayed, you can use the point manipulator to move the iso curve.
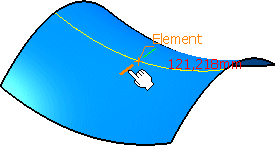
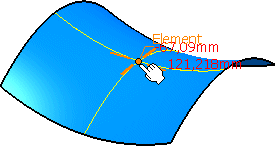
- Range: When switched on, the number of iso curves displayed is within the range specified.
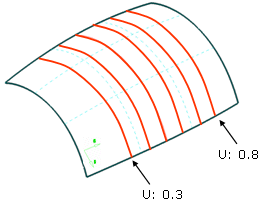
- Start U or V: The iso-parametric position of the 1st iso curve in the direction for both U and V can be specified.
- End U or V: If the number of iso curves entered is greater than 1, a parameter range can be specified
in which the curves will be displayed. The number of curves are equally spaced between the parameter start and end
values.
Direction: Along U
Range Start: 0.5
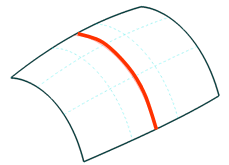
Direction: Along V
Range Start: 0.5
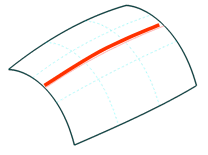
Direction: Along U & V
Range Start: 0.5
Direction: Along V, Number U: 6
Range Start: 0.3, End 0.8
- Options:
- Basic Surface: Computes the analysis on the basic surface in case of faces.
- Display: Parameters controlling the display of the spikes depending upon the 'Scale' value.
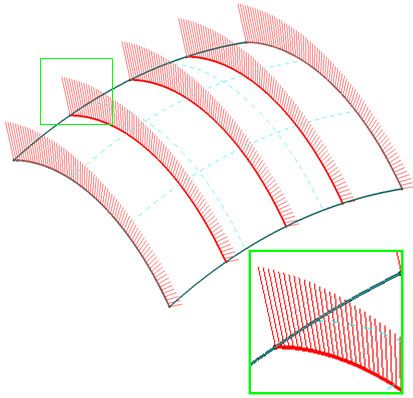
- Curvature: The spikes normal to each analysis curve will display the curvatures (1/r). The longer the spike length the smaller the curvature will be.
- Radius: The spikes normal to each analysis curve will display the curvature radii (r). The longer the spike
length the larger the curvature will be.
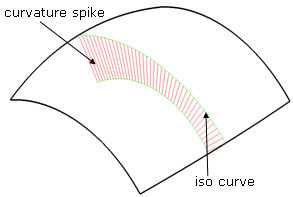
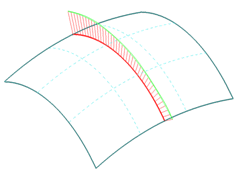
- Density: Discretization grid of equally distributed curvature spikes as they are displayed across the total
length of the iso curve.
Density = 10
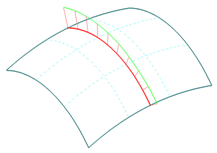
Density = 40
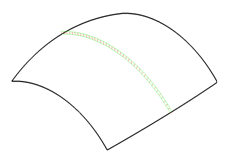
- Scale: Display scale factor for the curvature spikes.
Scale = 50
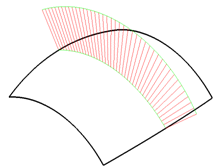
Scale = 3
- Options
- Min/Max: Displays local minimum and local maximum radii values of the computed iso curves.
- Invert: Inverts the normal direction of the curvature spikes.
- Comb: Selection of a color for the iso-curvature lines and comb for either U or V direction.
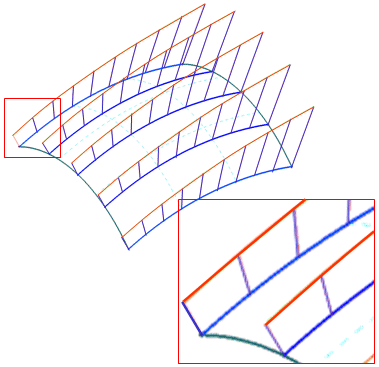
- Envelope: Selection of a color for the envelope that encompasses the iso-curvature comb in either U or
V direction. This envelope can be turned on or off.
![]()