Monitoring Resources with the Resource Gantt Chart

The resource Gantt chart allows users to determine visually that a particular resource is not used by two activities simultaneously. You can open two kinds of Gantt charts with Open Resource Gantt :

  • A resource-centric Gantt, which shows the processes to which a particular resource is assigned
  • A process-centric resource Gantt, which shows the resources assigned to a particular process.

This task has three parts:

Opening the Resource Gantt Chart

 
  1. Click Open Resource Gantt in the Data Views toolbar.

  2. In the PPR tree, click on either:

    • a resource, to open the Resource-centric Gantt and view all of the processes to which the selected resource is assigned, or

    • a process, to open the Process Centric Resource Gantt and view information on all of the resources assigned to the selected process.

      The Resource Centric Gantt window is displayed:
      You can also select either a resource (to get a Resource-centric Gantt chart) or a process (to get a Process-centric Resource Gantt) first, and then click Open Resource Gantt . Note that in the Resource Gantt, either resources or processes are shown. If you have pre-selected a product or an invalid entry, the Resource Gantt cannot be opened this way.
  3. Double-click on the Duration box of an activity to change its duration.
    In most cases, you can also double-click on the begin and end times for an activity/resource on the left side of the Gantt chart or drag the time bar (on the right side of the Gantt chart) to alter the times.  This method does not work if the cycle time is less than the duration of any of the TSAs for resource, because in that case, the begin time, end time or both for some of the resource's TSAs go beyond one cycle.

    This occurs when TSAs have precedence constraints and are the last TSAs to occur within a cycle. As a result, the background of the cell corresponding to the begin time/end time of that resource turns yellow and cannot be edited using the double-click method. However, the begin time or end time can be changed using the time bars for such TSAs, only if the new values are within the allowed range.

    Consider two cases in which there are three TSA’s that have precedence constraints. The precedence constraints keep the third activity from starting until the first and the second activities are completed.

    In the first case, the cycle time is set to 63 seconds and the duration for which the resource is used comes to a total of 63 seconds; therefore all the activities are completed within one cycle. The begin, end, and duration times are shown in normal (non-yellow) boxes, and you can edit them by double-clicking the boxes or the time bar.


    In the second case, the (specified) cycle time of the TSA is set to 60 seconds, which is less the resource duration (63 seconds). Consequently the third TSA begins in the second cycle, which necessarily runs in parallel with the first TSA of the second cycle, and therefore, the corresponding cells turn yellow. These times cannot be altered by double-clicking on the boxes.


Resource Gantt Chart Properties

  • The left frame of the Resource Gantt chart presents a table that lists the the selected resources. 
    • To the right of each activity are three columns displaying the duration, begin time, and end time for the resource within the activity.
    • Resources may be directly selected in the Gantt chart. Any selected resource is simultaneously highlighted in the PPR tree.
    • Right-click on a resource and select Properties to display the resource properties window.
    • To re-order the resources that are the children of a parent resource, you can drag and drop the child resource to another location among its sibling. For instance, in the example shown below, to move Station 2 so that it appears before Station 3, select Station 2 and move it above Station 3. A red square appears to show that the position before Station 3 is a valid position for Station 2 (i.e., the two resources share a common parent). Drop the resource into position. Reordering a resource moves its children in the Gantt to the new position. Top-level resources cannot be ordered.  They appear in the order of their selection in the Gantt.  The order you create is maintained when projects are saved back to the Manufacturing Hub.

  • The right frame provides a graphical representation of each process along the line of time, which also indicates the start, duration and end of each.
  • The chart displays all of the activities that use a selected resource on the same line. Holding the mouse cursor over an activity displays the activity name in its tooltip:
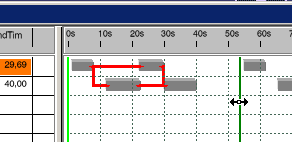
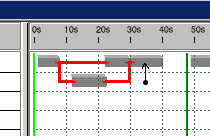
  • Logical activities (OrIn, AndIn, etc.) are indicated by red lines between the activities:
  • Vertical green lines in the right frame represent target cycle times. The cycle time can be changed by dragging and dropping the green line to a new location on the timeline:
  • Activities for a given resource may be dragged and dropped to another resource. The resource that the activity is dropped into is now used by the activity:

Also see: Opening the Gantt Chart