Visualizing Results
The following sections discuss some of the postprocessing options available in Nonlinear Structural Analysis or Thermal Analysis:
 Generating
a Results Image: Creates images
corresponding to Abaqus analysis results.
Generating
a Results Image: Creates images
corresponding to Abaqus analysis results.
 Querying values
for a results image: Probes values for
results images and generates reports.
Querying values
for a results image: Probes values for
results images and generates reports.
 Creating
a Display Group: Creates subsets of your
model for display purposes.
Creating
a Display Group: Creates subsets of your
model for display purposes.
 Animating
Images: Animates an image.
Animating
Images: Animates an image.
 Cut Plane
Analysis: Examines results in a cutting
plane.
Cut Plane
Analysis: Examines results in a cutting
plane.
 Deformation
Scale Factor: Scales the deformed mesh
amplitude.
Deformation
Scale Factor: Scales the deformed mesh
amplitude.
 Exporting
and Plotting History Data: Exports history
data to a tab-separated or text file and creates
X–Y plots of history
data.
Exporting
and Plotting History Data: Exports history
data to a tab-separated or text file and creates
X–Y plots of history
data.
 and
and  Creating a
Solution Sensor: Creates a sensor similar
to a CATIA Local or Global Sensor but using nonlinear or
thermal results.
Creating a
Solution Sensor: Creates a sensor similar
to a CATIA Local or Global Sensor but using nonlinear or
thermal results.
 Viewing
job diagnostics: Displays detailed
information about warnings and errors in a nonlinear or
thermal analysis.
Viewing
job diagnostics: Displays detailed
information about warnings and errors in a nonlinear or
thermal analysis.
 Generating a Results
Image
Generating a Results
Image
You can display graphic images of the results of your analysis. Many different types of images can be generated for an analysis case, depending on the results that are written to the output database, which in turn depend on the field output requests made prior to the analysis. The available result values depend on the step type, as described in Requesting Results. Deformation images display the shape of your model according to the values of a nodal result such as displacement. Contour (iso-value) images display analysis result values such as displacement, stress, or strain at a particular step and increment of your analysis as colored lines or bands. Symbol images display the magnitude and direction of vector or tensor results at a particular step and increment of your analysis. Text images display result values at a particular step and increment of your analysis as text labels.
Results images are saved when you save the analysis document that contains them. If you attach a new output database file to the analysis document, the images are deactivated. When you activate an image, it is validated against the current output database; if the results in the image do not match the results found in the output database, an error message is displayed. If you make changes to the model that do not affect the mesh, the results images will be considered valid regardless of whether or not they match the loads and boundary conditions in the analysis document.
Note: If the solver adjusts the undeformed nodal coordinates at the start of the analysis for connection purposes (in either contact or fastened connections), these coordinates are not adjusted in CATIA. Therefore, images of displacements reflect the original undeformed coordinates and do not take into account any initial node adjustments.
![]() This task shows you how to generate images
from the results in an Analysis Case
Solution.
This task shows you how to generate images
from the results in an Analysis Case
Solution.
-
Select the Analysis Case Solution object or one of its Step objects in the specification tree for which you want to see results, and click the Generate Results Image icon
. Tip: Alternatively,
you can right-click on the Analysis Case
Solution object or one of its Step objects in
the specification tree for which you want to
see results and select Generate Results
Image from the menu that
appears.
Tip: Alternatively,
you can right-click on the Analysis Case
Solution object or one of its Step objects in
the specification tree for which you want to
see results and select Generate Results
Image from the menu that
appears.The Abaqus Image Generation dialog box appears with a list of the results available for the specified step or analysis. By default, the current increment is set to the last increment of the step or analysis. The Abaqus solver units settings that were used at the time that the output database was attached are displayed. If the solver units do not match the units used to run the analysis, the result values and images will be incorrect. The Abaqus solver units are displayed for reference; units conversion occurs only when the input file is written and when the results are attached. For more information, see Configuring an Abaqus Analysis.
-
To select the step increment for which you want to generate the image, click Current Increment in the Abaqus Image Generation dialog box, select the increment number in the Increments dialog box that appears, and click OK to close the Increments dialog box.
Note: Only the increments for which results exist in the output database file are available.
-
Select the type of image you wish to generate from the list of Available Images.
-
If you want to create an image for one or more display groups or mesh parts in your model, click in the Generate Image On field, then select the display groups and mesh parts for which you want to create an image. The following types of display groups and mesh parts are eligible for selection in a generated image:
-
Display groups comprised of element sets or surfaces, but not display groups comprised of node sets.
-
Structural mesh parts, but not connection mesh parts. Connection mesh parts are components that are meshed with connection element types such as CONN3D2, which include springs, virtual parts, couplings, and rigid body constraints.
If you leave this field blank, Nonlinear Structural Analysis or Thermal Analysis creates an image for the whole model.
-
-
Click OK.
The Abaqus Image Generation dialog box disappears, and the image is generated automatically in the main window. A feature for the generated image appears in the specification tree.
-
To generate additional variations on the images that are listed in the Abaqus Image Generation dialog box, you can edit the images.
-
Double-click the image object in the specification tree, or right-click on the image object and select Object name>Definition from the menu that appears.
The Image Edition dialog box appears.
-
Select the desired options in the Image Edition dialog box.
As you modify the various options, the image displayed in the main window is updated to reflect your selections.
-
Querying Values for
a Results Image
You can probe a model or a results image to obtain information about your model or analysis. Probe functionality enables you to collect a list of nodes and elements of interest, examine them in the images and in tabular format in the Image Query dialog box, and export them to a text file or to a Microsoft Excel spreadsheet.
Note: The contents of the text file or spreadsheet you select are replaced with the data selected in the Image Query dialog box. Consider creating a new text file or spreadsheet for export purposes before you begin your queries.
-
the node's ID number,
-
the node's original coordinates,
-
and, for results images, the result value at the selected node in each selected results image.
If you probe element data, nodal data are displayed for every node included in the selected element definition. For Discontinuous iso results images, the element ID number is included as well.
You can compile probe values from multiple images, provided the images are all compatible. Results images are compatible for query purposes if they are all images of type Average iso or if they are all images of type Discontinuous iso. Symbol images showing more than one type of value are not eligible for query, and text images are not eligible for query.
By default, Nonlinear Structural Analysis and Thermal Analysis display probe values for results that are on the boundary or the outside of the model; interior nodes or elements are excluded from the query. To include interior values in your query, you must toggle off the On boundary option in the Color Map Edition dialog box. To open this dialog box, double-click the contour spectrum that appears in the right side of the CATIA window when a results image is displayed.
If you have data points selected in the table in the Image Query dialog box, you can highlight one or more of the table rows to display the selected nodes in the results image.
![]() This task shows you how to probe values for a
results image.
This task shows you how to probe values for a
results image.
-
Highlight the image or images that you want to investigate from the specification tree, then click the Query Values for a Results Image icon
.The Image Query dialog box appears.
-
Select Node or Element as the selection method.
-
Choose either of the following methods to add nodal data or element data to the table:
-
To add nodes or elements by their ID number, toggle on Node ID or Element ID, then enter the node or element identifier and click Add to table.
-
To add nodes or elements by selecting them from the results image, toggle off Node ID or Element ID, then click in the results image to select the nodes or elements that you want to investigate.
-
-
Toggle on Show number to display the node and element numbers in the results image for the rows that you highlight in the Image Query dialog box.
-
Specify the text file or spreadsheet to which you want to write probe data in the Save to file field.
-
Click Save to write the probe data to the specified file.
Nonlinear Structural Analysis or Thermal Analysis writes the selected data and opens the selected text file or spreadsheet.
Creating a Display
Group
You can display subsets of your model by creating display groups. These subsets can contain element sets, node sets, or surfaces from the output database associated with the current analysis case. Nonlinear Structural Analysis or Thermal Analysis automatically creates these sets and surfaces for “picked” geometry; for example, when you select a face on a geometric part as the support for a pressure load. You can use display groups as selections for images.
When you attach an output database file to an analysis case, any existing display groups in the analysis case are updated to apply to the contents of the new output database, if possible. If the sets or surfaces used in the display group do not exist in the new output database, the display group is deleted.
![]() This task shows you how to create a display
group.
This task shows you how to create a display
group.
-
Click the Create Display Group icon
.The Create Display Group dialog box appears, and a Display Group object appears in the specification tree under the Display Groups objects set for the current analysis case.
Note: If no output database file is associated with the current analysis case, an error message appears.
-
You can change the identifier of the display group by editing the Group Name field.
-
Toggle on Show internal sets to display only internal sets and surfaces in the Name field, or toggle off this option to display user-created sets and surfaces.
-
Select the type of item you wish to use to create the display group from the list on the left side of the Create Display Group dialog box: Node Sets, Element Sets, or Surfaces.
A list of the available set or surface names in your model appears on the right side of the Create Display Group dialog box.
-
Select one or more set or surface names from this list. To verify your selection, toggle on Highlight in viewport. (The sets or surfaces are highlighted on the undeformed model.)
-
Click OK in the Create Display Group dialog box.
Animating Images
Image animation is a continuous display of a sequence of frames obtained from a given image. Each frame represents either the final result displayed with a different amplitude or a particular point in time during a transient simulation. The frames are displayed in rapid succession, creating a movie-like effect. If the image was created for a Step object, the animation displays results from that step; if the image was created for the entire Analysis Case Solution object, the animation displays results from every step in the analysis except for frequency steps.
![]() This task shows you how to animate images.
This task shows you how to animate images.
-
Select an image object in the specification tree to make it active.
-
Click the Animate icon
in the Analysis
Tools toolbar.The Animate dialog box appears, and the image is animated in the main window with the default animation parameters.
-
You can modify the animation parameters as desired.
-
Control the animation play:
-
 Jump to the beginning
 -
 Play backward
 -
 Step backward
 -
 Pause
Pause -
 Step forward
 -
 Play forward
 -
 Jump to the end
-
-
Select the loop mode:
-
 Play once straight through
 -
 Play the images in order from the first
to the last, repeatedly
Play the images in order from the first
to the last, repeatedly -
 Play the images in order from the first
to the last and then in reverse order
from the last back to the first,
repeatedly
Play the images in order from the first
to the last and then in reverse order
from the last back to the first,
repeatedly
-
-
Specify the number of separate images to include in the animation by selecting a number from the Steps number drop-down list.
-
Control the animation speed by dragging the Speed slider to the desired value.
For a smooth animation set the number of images to the maximum value (20) and select the Repeat Play and Reverse
loop
mode. -
-
Click More in the Animate dialog box to see additional animation options.
-
Select the analysis step increments to include in the animation:
-
All occurrences animates the image over every increment in the analysis step. When you select this type of animation, you can choose whether or not to memorize the frames. If Memorize frames is toggled on, the animation will be faster but consume more memory.
-
One occurrence animates the image over a single selected increment in the analysis step by applying a range of scale factors to the analysis results. Click Select to access the Increments dialog box.
-
-
Select the animation mode for animations occurring over a single increment:
-
 Nonsymmetrical animation (default): This
animation mode corresponds to a
half-cycle scale factor range from 0 to
1.
Nonsymmetrical animation (default): This
animation mode corresponds to a
half-cycle scale factor range from 0 to
1. -
 Symmetrical animation: This animation
mode corresponds to a full-cycle scale
factor range from –1 to 1.
Symmetrical animation: This animation
mode corresponds to a full-cycle scale
factor range from –1 to 1.
-
-
Specify the interpolation method for nonsymmetrical animations:
-
Interpolate values animates over the interpolated values of the selected image.
-
Interpolate displacements animates over the interpolated displacements of the selected image.
-
-
-
Click Close in the Animate dialog box to exit animation mode.
Cut Plane
Analysis
Cut plane analysis consists of visualizing results in a plane section through a structure. By dynamically changing the position and orientation of the cutting plane, you can rapidly analyze the results inside a system.
![]() This task shows you how to use the cut plane
analysis capability.
This task shows you how to use the cut plane
analysis capability.
-
Select an image object in the specification tree to make it active.
-
Click the Cut Plane Analysis icon
in the
Analysis Tools toolbar.The cutting plane appears in the main window; in addition, the Cut Plane Analysis dialog box appears. The compass is positioned automatically on the model, and the cutting plane is positioned normal to the privileged direction of the compass.
Note: If the compass is already positioned in the view, the normal of the compass is considered to be the default normal of the cutting plane.
-
To rotate or translate the cutting plane, select an edge of the compass and drag the cursor.
As you modify the position of the plane, the results in the plane are updated automatically.
-
Toggle on View section only in the Cut Plane Analysis dialog box to see the section relative to the position of the cutting plane.
-
Toggle off Show cutting plane in the Cut Plane Analysis dialog box to see only the boundary of the cutting plane.
-
Click Close in the Cut Plane Analysis dialog box to exit the cut plane mode.
Deformation Scale
Factor
Setting the deformation scale factor consists of scaling the maximum displacement amplitude to be used for visualizing the deformed mesh. You can choose either a large scaling coefficient to zoom in on the deformed geometry or a scaling coefficient of 1 to obtain a realistic visualization of the deformation.
![]() This task shows you how to set the deformation
scale factor for a deformed mesh.
This task shows you how to set the deformation
scale factor for a deformed mesh.
-
Select an image object in the specification tree to make it active.
-
Click the Deformation Scale Factor icon
in the
Analysis Tools toolbar.The Deformation Scale Factor dialog box appears.
-
You can modify the deformation scale factor parameters as desired.
-
Drag the Magnification slider from 0 to Max to dynamically change the scale factor.
-
Enter a value for the scaling coefficient in the Scaling factor field.
-
Enter a value for the maximum allowable displacement (in mm) on the image in the Maximum displacement field.
-
-
Click OK to close the Deformation Scale Factor dialog box.
Exporting and
Plotting History Data
If you request history output for your model (see Creating and Modifying History Output Requests), the requested data are saved in the output database (ODB) file. You can also select the history data for selected variables and steps and perform any of the following operations:
-
Write the data to a tab-separated file or to a text file.
-
Display the data in an X–Y plot in Microsoft Excel. By default, each variable you select is plotted against time, but you can create a variable versus variable plot to investigate the relationship between two variables in the analysis.
For General Static steps, you can also create an energy plot in Microsoft Excel. Energy plots display data from any of the principal energy-related history output variables that are selected in each solution step of the output database in an X–Y plot. Principal energy-related history output includes variables such as ALLIE (total strain energy), ALLKE (kinetic energy), and ETOTAL (total energy). Each variable is plotted in a separate X–Y plot; and if a variable is requested across steps, the plot displays blue triangles along the X-axis that indicate the beginning and end of each step.
Note: The Nonlinear Structural Analysis and Thermal Analysis workbenches display history data plots and energy plots in Microsoft Excel, so you must have this software installed to use either of these integrated X–Y plotting features.
![]() This task shows you how to export history data
to a text file or plot history data.
This task shows you how to export history data
to a text file or plot history data.
-
Select an image object in the specification tree to make it active.
-
Click the Plot History Data icon
in the
Postprocessing toolbar.The Plot History Data dialog box appears.
-
Select the desired history output variable data from the list. You can export or plot history data for multiple variables; in the Plot History Data dialog box, [Shift]+Click to select multiple consecutive rows or [Ctrl]+Click to select multiple non-consecutive rows.
By default, the Nonlinear Structural Analysis and Thermal Analysis workbenches export or plot each variable you select against time. However, if you select two variables, you can export or plot the variables in the same plot. The first variable you select will be displayed along the X–axis; the second variable along the Y–axis.
-
Select the step or steps for which the Nonlinear Structural Analysis and Thermal Analysis workbenches will export or plot the selected data. You can export or plot history data for multiple steps; in the Plot History Data dialog box, [Shift]+Click to select multiple consecutive rows or [Ctrl]+Click to select multiple non-consecutive rows.
-
If you selected two rows of history data, toggle on Variable from the Output format options to export or plot the selected data against each other. You can alternatively select Time to plot both of these variables separately against time.
-
For history data export, enter or select the path to the file where the data will be saved.
-
Perform one of the following steps:
-
For history data export, click Save to write the selected history data to the file.
If the selected filename already exists, Nonlinear Structural Analysis or Thermal Analysis asks whether you want to overwrite the existing file.
-
For an X–Y plot, click Plot to display an X–Y plot for the selected variables in Microsoft Excel.
-
To create X–Y plots of all the energy quantities in a General Static step, right-click the step in the specification tree and select Create Energy Plot from the list that appears. The Nonlinear Structural Analysis or Thermal Analysis workbench launches Microsoft Excel and plots any of the principal energy-related output variables requested in the selected step for the whole model.
Creating a Solution
Sensor
Local sensors record local values for field output results during an analysis step. Global sensors record values for history output results for “whole model” quantities during an analysis step. You can use the data collected by sensors to review the progression of the analysis and obtain specific results from the general output. Possible uses for sensors include the following:
-
Determine the relative motion of two points
-
Determine the minimum, average, and maximum values of the selected output variable at a point
-
Create an X–Y plot of the sensor values
-
Run the Product Engineering Optimizer
![]() This task shows you how to create and validate
a solution sensor.
This task shows you how to create and validate
a solution sensor.
-
Click the Create Local Sensor icon
or the Create
Global Sensor icon in the
Postprocessing toolbar. -
Select the Step object for which you want to create the sensor. The Step objects are located under the Analysis Case Solution objects set in the specification tree.
Alternatively, you can select a results image from the main window, if one is displayed. For more information, see Generating a Results Image. Nonlinear Structural Analysis and Thermal Analysis use the solution step for which the results image was created as the support for the sensor.
The Create Local Sensor or Create Global Sensor dialog box appears, according to your selection in Step 1.
-
Select a result variable from the list. The available results depend on the output variables for the selected step:
-
Local sensors use the field output variable results
-
Global sensors use the “whole model” history output variable results
-
-
Click OK to close the dialog box and to create the sensor.
Nonlinear Structural Analysis or Thermal Analysis creates the new sensor object in the Solution Sensors object set in the specification tree.
-
For local sensors, double-click the new sensor object to complete the sensor definition.
The Nonlinear Structural Analysis or Thermal Analysis workbench opens the Local Sensor dialog box.
-
Select the Supports, Occurrences, and Post-Treatment values that you want the sensor to capture.
-
Toggle on Create Parameters to make the sensor available in Knowledgeware formulas.
-
Click OK to close the Local Sensor dialog box.
-
-
Right-click on the sensor object in the specification tree, and select Update Sensor.
The Nonlinear Structural Analysis or Thermal Analysis workbench updates the value of the sensor using the model results.
-
If a local sensor has more than one value, you can right-click on the sensor object in the specification tree and select Generate 2D Display to plot the values.
The Nonlinear Structural Analysis or Thermal Analysis workbench plots the sensor values.
Note: Due to the incremental solution technique used to analyze each step, the sensor output for parameters is a list of values. You must use formula commands that are intended for list data, such as getItem(), to access the sensor values. For example, the following Knowledgeware syntax allows you to use a displacement sensor value for the first (GetItem(1)) or last (...Size()) increment:
`Finite Element Model.1\Displacement component.1\List.1` -> GetItem(1)

`Finite Element Model.1\Displacement component.1\List.1` -> GetItem(
    `Finite Element Model.1\Displacement component.1\List.1`->Size() )
For more information on Knowledgeware, see
Applying
Knowledgeware.
If you update and rerun an analysis such that the output used by a sensor is no longer available, the Nonlinear Structural Analysis or Thermal Analysis workbench marks the sensor (INVALID) in the specification tree when you attach the new results.
Displaying Job
Diagnostics
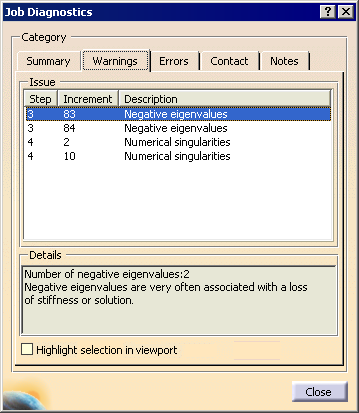
During an analysis, diagnostic information concerning the progress of the analysis is saved in the output database file. The Job Diagnostics tool in shown in Figure 15–1 organizes this information and provides a visual link between the diagnostics and the physical model. Diagnostics can be used to determine the cause of a failed analysis and identify areas of a model that must be revised or redefined.
Diagnostic information is organized according to the steps, increments, and—for contact diagnostics—iterations in an analysis. This organization allows you to determine the stage of the analysis in which warnings, errors, or other problems occur.
The following information is available from the Job Diagnostics tool:
Summary
The Summary page displays general information about the job, including the job's name, the status of the analysis, the number of increments in each step, and the number of warning and error messages generated by the analysis.
Warnings
The Warnings page displays issues in the analysis that could potentially lead to undesirable results but do not necessarily cause the analysis to fail. Warnings can be ignored if they are the result of an expected condition or behavior in the model. Warnings from only the last iteration of the last attempt of each increment are displayed. Warnings are available only for jobs involving a Structural Analysis case.
There are three possible warnings:
Numerical singularities: Numerical singularities typically result from rigid body motion, in which a portion of the model offers no resistance to the applied loads. A numerical singularity may indicate the need for additional boundary conditions or constraints in a portion of the model.
Negative eigenvalues: Negative eigenvalues result from a loss of stiffness in the model due to material softening or the sudden buckling of a structure under a load. Negative eigenvalues are common in analyses involving large deformations but may indicate a problem with the model properties in small-deformation analyses.
Zero pivot: Zero pivots generally indicate an overconstraint in the model, typically due to redundant boundary conditions or constraints. An overconstrained node may still behave appropriately, but the presence of redundant constraints could be a modeling problem that leads to undesirable behavior in other portions of the model. A zero pivot also sometimes arises due to rigid body motion.
Errors
The Errors page displays the reason that an analysis aborted or terminated, including the step and increment in which the fatal error occurred.
Contact
The Contact page displays changes in contact status for each iteration in the analysis. A change in contact status involves a node on the slave surface becoming either overclosed (moving into contact with the master surface) or opened (moving out of contact with the master surface). Contact diagnostics are available only for jobs involving a Nonlinear Structural Analysis case.
Notes
For a failed Nonlinear Structural Analysis job, the Notes page displays additional details concerning the error that caused the failure.
For certain warning messages, error messages, and contact diagnostics, you can see which nodes or elements are involved in each diagnostic message using the Highlight selection in viewport option. For warning and error messages, the nodes or elements causing the warning or error are highlighted in the model. For contact diagnostics, the nodes that are overclosing or opening are highlighted in the model.
The Job Diagnostics tool displays information for the most recently attached or imported output database in your Nonlinear Structural Analysis or Thermal Analysis session. The information displayed by the tool is a subset of the diagnostics that appear in the Abaqus data, status, and message files; for details about these files, see Understanding the Files Generated by Analyzing a Model in Abaqus.
![]() This task shows you how to display job
diagnostics.
This task shows you how to display job
diagnostics.
-
Click the Job Diagnostics icon
in the
Postprocessing toolbar.The Job Diagnostics dialog box appears with information from the most recently attached or imported output database.
-
Click the Summary, Warnings, Errors, Contact, and Notes tabs to switch between the various types of diagnostic information, as described above.
-
To highlight the nodes or elements associated with a particular warning, error, or contact status message, click on the message in the Issue table, and toggle on Highlight selection in viewport.
-
When you are done reviewing diagnostic information, click Close to close the Job Diagnostics dialog box.